© 2024 WVIK
Listen at 90.3 FM and 98.3 FM in the Quad Cities, 95.9 FM in Dubuque, or on the WVIK app!
Play Live Radio
Next Up:
0:00
0:00
0:00 0:00
Available On Air Stations

Research Shows Many More People Had COVID Antibodies During 1st Half of Pandemic

Geographic distribution of undiagnosed seropositivity in the United States from May to July 2020. Raw serology data for (A) IgG, (B) IgM, and (C) IgA against SARS-CoV-2 spike protein and the receptor binding domain (RBD) of spike protein are displayed. Cut points for positivity are shown as red dashed lines; data are optical density (OD). (D) Serologic phenotype of antibody presence in 304 seropositive participants. (E) The map of the United States displays seropositivity in the six regions surveyed: Northeast: ME, NH, VT, MA, NY, CT, RI, PA, and NJ, 7.5% (95% CI, 3.9% to 12.4%); Midwest: MN, IA, WI, IL, IN, MI, and OH, 1.6% (95% CI, 0.3% to 2.4%); Mid-Atlantic: MD, DE, DC, VA, WV, KY, TN, NC, SC, and GA, 8.6% (95% CI, 2.6% to 18.9%); South/Central: FL, MS, AL, LA, AR, MO, KS, and OK, 3.0% (95% CI, 1.2% to 5.0%); Mountain/Southwest: TX, NM, AZ, CO, UT, WY, NE, SD, ND, MT, and ID, 4.5% (95% CI, 1.3% to 9.5%); West/Pacific: WA, OR, NV, CA, AK, and HI, 1.9% (95% CI, 0.2% to 3.8%). Each person in (E) represents 100 participants; orange represents weighted prevalence estimate within the geographic region.
https://stm.sciencemag.org/content/scitransmed/13/601/eabh3826/F2.large.jpg
/
Science Translational Medicine 07 Jul 2021: Vol. 13, Issue 601, eabh3826 DOI: 10.1126/scitranslmed.abh3826
Geographic distribution of undiagnosed seropositivity in the United States from May to July 2020. Raw serology data for (A) IgG, (B) IgM, and (C) IgA against SARS-CoV-2 spike protein and the receptor binding domain (RBD) of spike protein are displayed. Cut points for positivity are shown as red dashed lines; data are optical density (OD). (D) Serologic phenotype of antibody presence in 304 seropositive participants. (E) The map of the United States displays seropositivity in the six regions surveyed: Northeast: ME, NH, VT, MA, NY, CT, RI, PA, and NJ, 7.5% (95% CI, 3.9% to 12.4%); Midwest: MN, IA, WI, IL, IN, MI, and OH, 1.6% (95% CI, 0.3% to 2.4%); Mid-Atlantic: MD, DE, DC, VA, WV, KY, TN, NC, SC, and GA, 8.6% (95% CI, 2.6% to 18.9%); South/Central: FL, MS, AL, LA, AR, MO, KS, and OK, 3.0% (95% CI, 1.2% to 5.0%); Mountain/Southwest: TX, NM, AZ, CO, UT, WY, NE, SD, ND, MT, and ID, 4.5% (95% CI, 1.3% to 9.5%); West/Pacific: WA, OR, NV, CA, AK, and HI, 1.9% (95% CI, 0.2% to 3.8%). Each person in (E) represents 100 participants; orange represents weighted prevalence estimate within the geographic region.

When the coronavirus pandemic began, health officials said it caused a new infection that we knew very little about.

So a team of researchers at the National Institutes of Health started a clinical study to find out how prevalent COVID-19 was all over the United States.

Michelle O'Neill reports the peer-reviewed study found there were four to five times more undiagnosed cases of COVID-19 for every known case.
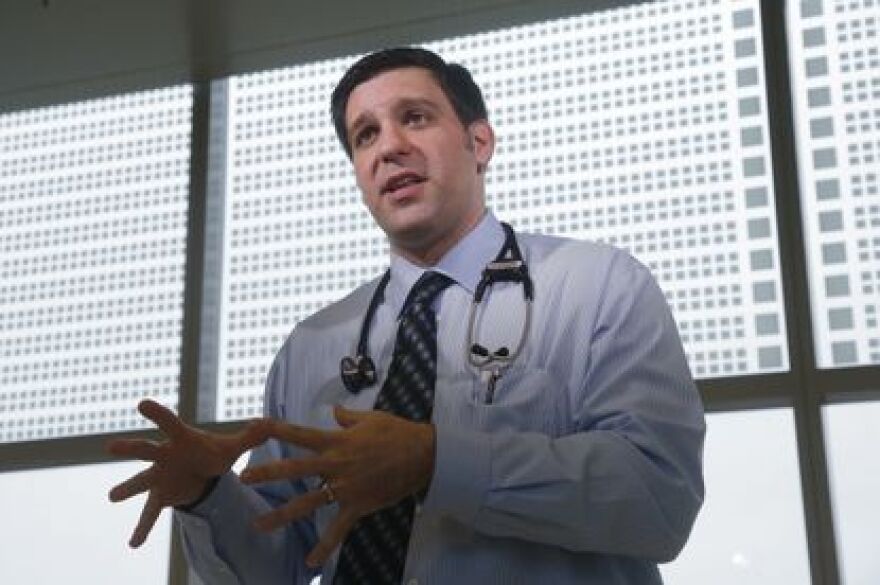
Dr. Matthew Memoli, Director of the Clinical Studies Unit in NIAID's Laboratory of Infectious Diseases
https://www.niaid.nih.gov/research/matthew-j-memoli-md-ms
/
NIAID NIH
Dr. Matthew Memoli, Director of the Clinical Studies Unit in NIAID's Laboratory of Infectious Diseases

Lead Investigator, Dr. Matt Memoli, and his team worked with two universities to conduct the study entitled, "Undiagnosed SARS-CoV-2 Seropositivity During the First Six Months of the COVID-19 Pandemic in the United States."

The clinical study is online published by "Science Translational Medicine."

Officially, Michelle's title for 28 years was WVIK News Editor. She did everything there is to do in the newsroom and whatever was needed around the radio station. She also served as Acting News Director from September 2023 - January 2024.
Related Content